
3·
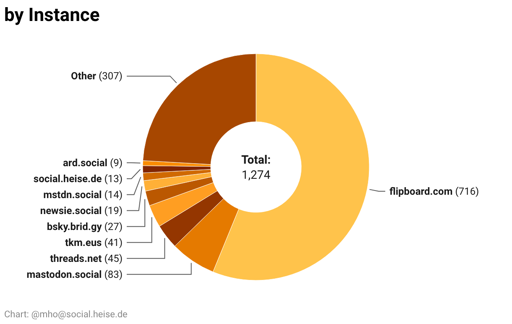
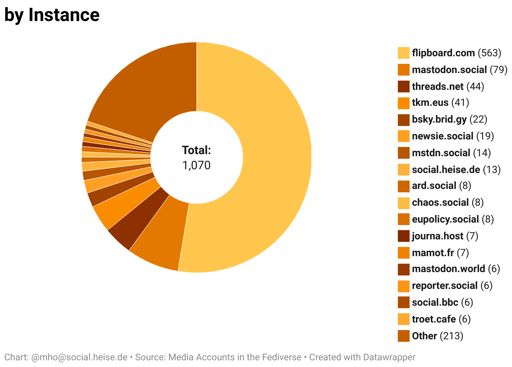
4 days agoYes, you’re right. I changed tha graph for instances and will look into the others. But not today 😴
Yes, you’re right. I changed tha graph for instances and will look into the others. But not today 😴
I found their explanation and as I suspected, they don’t want to distract you. 😉 https://www.datawrapper.de/blog/pie-charts But they’re also saying, that this is not the right chart for so many values. So I’ll retry.
They’ll basically have to have a link to the account in their website.
That’s the standard in DataWrapper. From my experience they surely have a blogpost on why this is the only right way to do it. 😉
It takes a couple of seconds to load the data.
With a mouse, you can hover over it and it will highlight the corresponding part.
There are numbers, too.
But I’ll look into it. I’m using DataWrapper and it’s not very customizable.
We (@heiseonline@social.heise.de) have federated accounts on #Flipboard: The problem is, you still can only see the interactions in the app. But there you can’t easily switch between two accounts. So I have my private one activated – and won’t see the interactions.
And you’re right: For accounts from organizations, that are in the #Fediverse a federated account on Flipboard is not of much use. But there are some, that aren’t otherwise reachable from the Fediverse. (RSS is another story, that’s true)
Yeah, I’ll try